Previous investigators have used "expression law" and "impression law" to assess a precisely fixed quantity scale of Kansei. However, both of them are still under development and cannot be conducted completely. And, it's seems the development of "impression law" can be expected.
Subject was asked to touch a coarse object without being able to see this object. After touching this object, subject then presented their physical stimulation by a way of adjusting the noise image visually. For instance, visual image data can be used to define and classify the Kansei of touch. Further, the obtained Kansei on touch can be organized in a way to reflect the visual image of tactile Kansei. Thus, this study helps to clarify the issue that sense of tactile and visual acuity might reflect synesthesia.
At the present stage, the output and input parts of C&C product have not been able to posite together. It means, users must watch the output device and operate without being able to see the input device. Research that seeks to applicate on User-Interface between sense of touch and visual acuity is high recommended.
Beginning in 1986, the word, "Kansei-Engineering", was used by Mr. K. Yamamoto (chairman of the MAZDA-Auto Group) to describe the philosophy of car-making. To date, the concept of "Kansei-Engineering" has played an important role in the field of Industrial Design as well as other sciences during the past decades.
"Kansei Engineering" has been highly evaluated as the advanced technology of product development, which expresses the consumer demand in the design domain. In order to create a living environment, in which people are able to attain a better comfortable lifestyle, "Kansei Engineering" has been functioned as an ergonomic consumer oriental technology on new product development. Based on the human cognitive model, "Kansei Engineering" has attempted to create a pleasing and satisfying product for each user and consumer.
That is, "Kansei Engineering" can be defined as translating the technology of consumer's “Kansei" (physiological sensibility and psychological feelings) on new products into the design domain. Unfortunately, the question of how to measure the Kansei of a human being has remained unanswered.
Each modality of senses is not independent, but interacts with the others in a complex process. First of all, researchers of experimental psychology have attempted to establish several kinds of interactions among sensory modalities.
Previous psychology researches on sensation and perception have shown that the "Intermodality" phenomenon is existing. The condition of intermodality, in which a stimulus receives one sensory modality and reacts in another sensory modality subliminally. For example, the people somewhat can "hear" (feel) the bright or dark sound without seeing a thing. This phenomenon shows clearly that there are some innate qualities acrossing the different sensory modalities.
Secondly, each sensory acuity of human beings can be influenced by the other senses, which, in turn, have an effect on the advanced components of actions. This effect needs to be taken into account when it comes to the measurement of sensitivity. For example, even a slight action can induce interactive functioning of more than one sense at the same time, which is the phenomenon of "intersensory facilitation & inhibition".
Finally, the unique condition of "synesthesia", in which a stimulus receives one sensory modality and gives rise to an experience in another, has been known to the scientific community for nearly 300 years and yet remained relatively unexplored.
This aim of this paper is to develop a new method for measuring Kansei based on these phenomena.
Fig.1 Model of quantificational measurement
Basically, previous investigators have used the "expression law" and the "impression law" to assess the scale of Kansei of the sensory modality.
The expression law, usually be used in psychophysics and experimental psychology, measuring the sensibility by special equipment and obtaining a quantificational value-like data. The measurement like this may be understood as the response of physical sensibility, although it cannot describe the mental feeling of human’s Kansei completely. Nonetheless, the extension law, which measures the sensitivity through the physiology-like data, cannot be conducted perfectly. The method by the expression law has been tried to approach the value of g .
On the other side, the impression law, which tries to assess the data on the mentality information through a precisely fixed quantity scale, is still under development. Social science scholars, especially psychologists and cognitive science researchers, like to use the measuring method as this way to obtain the sensory attributes of people. They tend to ask testee directly by using the questionnaire to get the responses. The famous "SD method" (Semantic Difference method) is a typical method to reach the numerical data. Obviously, the method by the impression law has tried to approach the value of x.Subjects were asked to adjust the visual noise effect of Adobe PhotoShop 4.0 on the monitor of the computer. The range of noise amount can be adjusted from amount 1 to 999 (see Fig 2).
Fig.2 adjustment of visual noise in this dialogue
To avoid interference with the effect of intersensory facilitation & inhibition, all experiments were constructed to stay in the same environment as possible. We used the same monitor and the same setting to avoid different lighting situations, control the noise condition of testing environment in the same situation, and record the temperature of each time (distributed from 22.3 to 27.0℃).
1. 4 big objects (sandpaper of 200×200mm) by haptic touch
2. 4 small objects (sandpaper of 30×30mm) by haptic touch
3. 4 small objects by thumb finger of left hand only
4. 4 small objects by index finger of left hand only
5. 4 small objects by middle finger of left hand only
6. 4 small objects by thumb finger of right hand only
7. 4 small objects by index finger of right hand only
8.4 small objects by middle finger of right hand only
- Procedures
Fig.3 Subject be tested in this experiment
To avoid the sensory inhibition phenomenon, each experimental situation was held in a short period of time, with breaks after per 15 minutes. Time spent for each subject was recorded (the maximum time is 57 seconds, and the minimum is just 3 seconds).
Results
The adjustment of the scale
of visual noise-effect was recorded for each subject. 20 subjects, stimuli
of 4 levels, were asked for 8 times of experiments in different situation.
Thus, 640 results of response were obtained. Partial of the results was
summarized in Table 1.
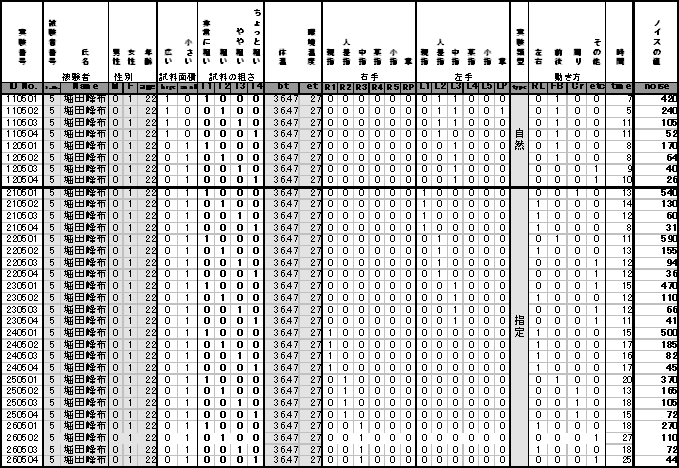
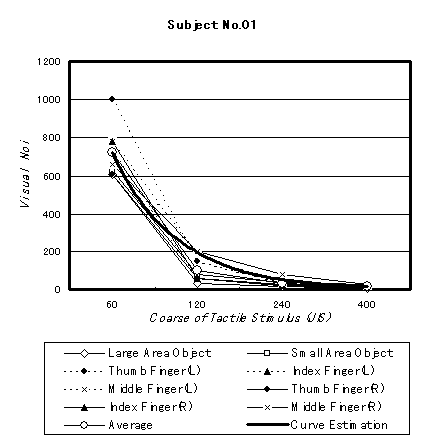 Fig.4
response for different stimulus (subject No.01)
Trend analysis
For checking the correlation between the independent variable (i.e., value
of tactile coarse stimulus) and the dependent variable (i.e., amount of
visual noise effect), the "Trend Analysis" was used to analyze the data for
each subject.
First,
the general factorial ANOVA was conducted to test the P-Value is
under 0.05 or not. Then, the Trend Analysis of MANOVA implemented in SPSS
was carried out. These results were summarized in Table 2.
Correlation analysis
To
determine the correlation between the tactile coarse stimulus and the visual
noise effect, the "Correlation Analysis" was conducted on each subject.
Except for four
subjects with a Pearson's correlation coefficient greater than 0.840, all
other subjects were significant at the 0.01 level with a 2-tailed test (Tab.
3 and 4). In addition, the graphs of "Correlation Analysis" seem to indicate
a nonlinear relationship among the subjects.
Table
3 Result of Correlation analysis (subject 1 and 2)
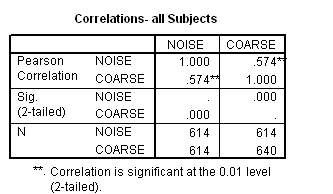 Table
4 Result of Correlation analysis (all subjects)
Regression analysis
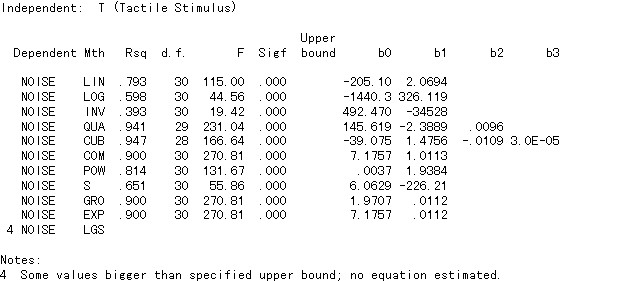 Table
5 Result of Regression Analysis (subject No.01)
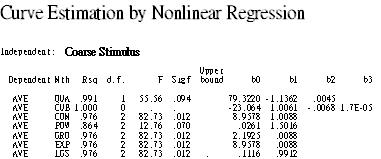
Thus, used the "Nonlinear Regression Analysis" again to examine for the
total average value of all subjects. And three formula as follows can be
found obviously.(see Tab.6 and Fig.5) All of the R2 value
(Rsq.) of these three curve estimation are above 0.97.
Y
= (1.7E-05)
t 3 –
0.0068t 2+ 1.0061t
– 23.064
Y = e(2.1925 + 0.0088t)
Y = 8.9578*e(0.0088t)
 Table
6
Result of Regression Analysis (total average)
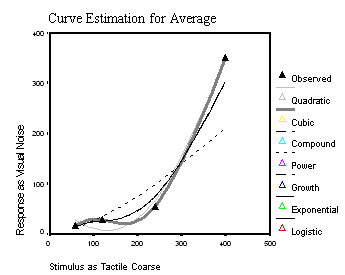
The results of this experiment indicate a relationship between the tactile coarse stimulus and the visual noise response, and the tactile coarse reception is more sensitive than visual expression scale. In addition, this relationship seems to be consistent with a nonlinear correlation. For the author just used 4-difference tactile coarse stimulus in this experiment, so it’s difficult to judge the cubic relationship (Y = (1.7E-05) t 3 – 0.0068t 2+ 1.0061t – 23.064) is absolute or not with certainty.
In the other side, through this experiment, there are two relationship result, Y = e(2.1925 + 0.0088t) and Y = 8.9578*e(0.0088t), were identified also. Based on the famous equation of "Weber-Fechner’s law" in psychophysics, we know that if the E is the value of sensitivity and the R is the value of stimulus, then there is a relationship. Accordingly, we can suspect that this law is fit across two different modalities.
Of course, Kansei, as a complex combination of feeling and perception, is not easy to measure it clearly and accurately. Compared with the traditional questionnaire, measurement by cross-modality matching can obtain the metric data easily.
This paper describes the qualitative evaluation of coarse tactile Kansei by using the cross-modality matching with visual noise impression. The author tried to build a theoretical model to explain how this new measurement can be used to approach quantificational Kansei.
For example, generally when a person receiving a coarse tactile stimulus (st) from the outside, he/she has used all sensibilities to perception factually in the nature situation. It means, he/she also receives the visual stimulus (sv) and the others kinds of input in the same time. By each modality, this person receipt/fell the different perception. In tactile modality, he/she fell the tactile perception xv(see Fig.6), and also he/she feel the visual perception xv in visual modality (see Fig.7), too. Than, he/she matches the perceptions cross the different modalities and integrates to a Kansei to output. Thus, we can build a model like Fig.8 showed.
If this model is tenable, it will be helpful for designer to develop the user’s interface in future. Because the coarse tactile reception is more sensitive than visual noise expression, therefore the designer maybe can design the buttons and switches by different coarse surface, as a useful hint to guide users for using the products.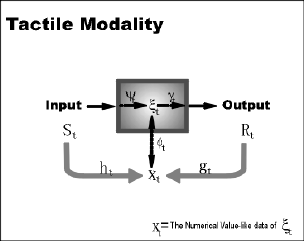 Fig.6
Model of tactile modality
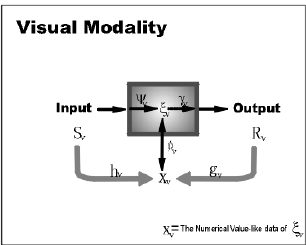 Fig.7
Model of visual modality
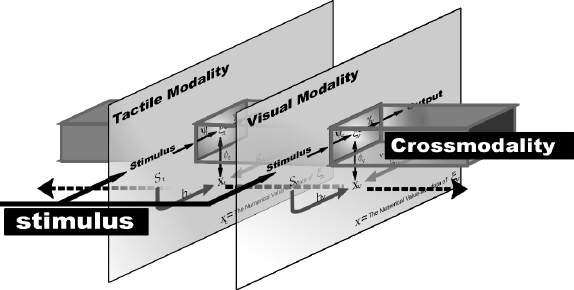 Fig.8
Be a new
measurement technology
Fig.8
Be a new
measurement technologyReferences